







A sphere cannot be laid flat without its surface being stretched, squeezed or torn somewhere. Carl Friedrich Gauss proved this mathematically, and his theorem implies that you cannot even wrap a piece of paper around a ball without creasing it. Every flat map of the world therefore distorts something: shape, area, distance or direction. That is why the continents look different on a map than on a globe.
You will find a well-known example on an ordinary Mercator map. Greenland looks roughly as big as Africa on it, although Africa is in fact about 14 times larger. A globe does not have this error, because it is a sphere itself, so on it you see the continents in the right proportions, together with the tilt of the Earth’s axis.
Contents of the article
Why a sphere cannot be laid flat
You can bend a flat sheet of paper into a tube or a cone and nothing on it creases or tears. The distances between points on the paper stay the same; the paper only bends. A sphere, however, is curved in all directions at once. When you want to spread it out flat, you have to stretch the surface in one place, squeeze it in another or cut it open.
Cartographers, the people who make maps, solve this problem with a projection. A projection is a mathematical rule that assigns a point on the plane to every point on the sphere. No rule can preserve everything at once, so every projection chooses what to keep and what to sacrifice. Globe makers go the opposite way: they print the map on long, narrow strips of paper that taper to a point towards the poles, and glue them onto the sphere. The more strips they use, the less they have to stretch and crease the paper.
What a map distorts: shape, area or distance
A flat map can show one or several of these properties correctly, but never all of them at once: directions, distances, areas and shapes. A map that preserves the shapes of small areas, called conformal, cannot preserve areas at the same time. And a map with correct areas twists shapes instead.
The difference is easy to see on four types of maps you often come across:
| Map | What it keeps | What it distorts | What it is used for |
|---|---|---|---|
| Mercator (1569) | angles and shapes of small areas; a line of constant course is a straight line on it | areas far from the equator; it does not show the poles at all | sea navigation, maps of the equatorial region, online maps |
| Gall–Peters | areas; regions have the correct size ratio | the shapes of most regions | comparing the sizes of countries and continents |
| azimuthal equidistant | distances and directions from one central point | shapes and areas further from the centre | distances from one place, for example from the pole on the UN flag |
| compromise (Robinson, Winkel) | nothing completely exactly | a little of everything, nothing extreme | world maps in atlases |
Mercator presented his map in 1569, and it was a great help to sailors: a course they drew as a straight line could be held with a compass. The scale of the map, however, grows with distance from the equator. Above 70° north or south latitude the map is practically unusable, and at the poles the scale would be infinite, so the map does not show them. Greenland has an area of about 2.17 million km², Africa about 30 million km², and yet they look similar in size on the map.
The Gall–Peters map does the opposite. James Gall described it in 1855, and Arno Peters popularised it in the early 1970s. Areas on it are right, but the shapes of most continents are visibly warped. Cartographers also show distortion with small circles of the same size, which they place all over the surface of the globe. On the map they turn into ellipses of different sizes and shapes, and where they differ most from a circle, the distortion is greatest.
What to notice on a globe
A globe is the only map of the world that has no distortion from a projection. When you have one at home or at school, notice these places:
- Tilt of the axis. The axis of a globe usually does not stand vertically but is tilted by about 23.4°. The Earth’s axis is tilted in the same way to the plane in which the Earth orbits the Sun, and it is this tilt that causes the change of seasons.
- Parallels. Circles parallel to the equator get smaller towards the poles. The tropics lie at 23°26′ north and south latitude, exactly the tilt of the axis away from the equator, and the polar circles at 66°33′. On a Mercator map all parallels have the same length as the equator, which is why countries near the poles are stretched.
- Meridians. The lines from pole to pole meet at one point on a globe. On a Mercator map they are parallel vertical straight lines that never meet.
- Greenland and Africa. Turn the globe so that you see both regions at once, and compare their size. Then look at the same place on an ordinary world map.
The oldest surviving globe, the so-called Erdapfel of Martin Behaim, dates from 1492. The principle has not changed since: a sphere with a grid of parallels and meridians shows the Earth without the compromises that every flat map has to make.
Experiment at home: an orange instead of a globe
You can check what Gauss proved in a few minutes with one orange and a marker.
- With the marker, draw several circles of the same size on the peel: one around the “equator” in the middle of the orange and one near the stem, which will be the “pole”.
- Peel the orange so that the peel stays in one piece.
- Lay the peel on the table with the inner side down and try to press it completely flat.
- Look at what happened: the peel does not flatten by itself, and when you press it, it tears or stretches. The circles in the places where the peel stretched change shape.
Every map deals with exactly this problem. It either tears the surface into strips, as globe makers do, or stretches and warps it, as Mercator does near the poles. The circles on the peel work in the same way as the circles cartographers use to show distortion.
What to notice on a globe model
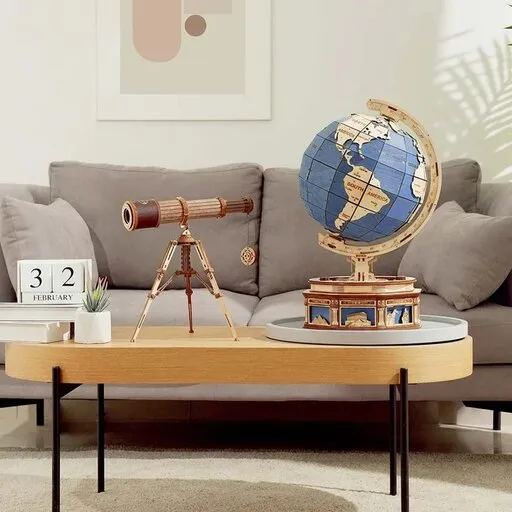
If you build a globe yourself, you hold everything we have talked about in your hands: the sphere, the axis and the grid of lines. What exactly your model imitates, you will find out from its instructions and pictures. While building, notice these places:
- The axis and how it is held. Check whether the axis of the model is tilted and how the stand holds it. If the model shows the tilt, compare it with a vertical line.
- The surface of the sphere. Look at what the sphere is made of. If the map is divided into parts or strips, notice how they narrow towards the poles and where they meet.
- Parallels and meridians. If the model has them, watch how the parallels get smaller and the meridians converge. It is the same picture as on a real globe.
If a globe with gears turns stiffly or sticks, you will find how to look for friction in the article Sticking mechanism: how to find the friction and fix it. And when a model with a light stops shining, the article Miniature house not lighting: batteries, contacts and cables will help.
You can look at these parts on a model such as Wooden 3D puzzle - Luminous globe ROKR ST003. According to the shop description, it has a transparent map, a gear drive, a latitude holder, a magnifying glass and a warm night light with a Micro USB connection. According to the shop details, it is intended for ages 14 and up.

Frequently asked questions
Is there a world map that distorts nothing?
No. A sphere cannot be laid flat without stretching or tearing, so every flat map distorts something. Choose a map by its purpose: a map with correct areas for comparing the sizes of countries, a map with correct angles for navigation.
Why is Greenland so big on the map?
On a Mercator map the scale grows towards the poles. Greenland lies far in the north, so it looks similar in size to Africa, although Africa is about 14 times larger.
Why is the axis of a globe tilted?
The globe imitates the tilt of the Earth’s axis, which is tilted by about 23.4° to the plane of the Earth’s orbit around the Sun. This tilt causes the change of seasons.
Why are the poles missing on some maps?
The Mercator map would need an infinite scale at the poles, so it does not show them at all. Above 70° north or south latitude the distortion is also so great that the map is practically unusable there.